Les écrans d’AAPS
Écran d’accueil
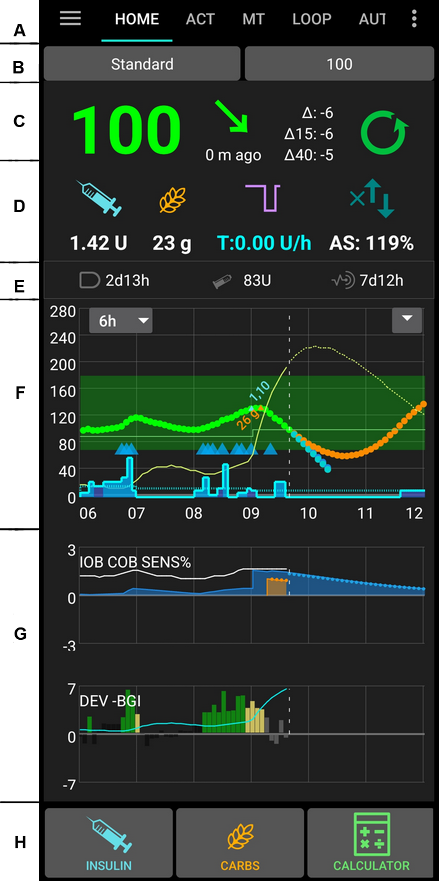
Ceci est le premier écran que vous verrez quand vous ouvrirez AAPS, il contient la plupart des informations dont vous aurez besoin au jour le jour.
Section A - Onglets
Permet de naviguer entre les différents modules AAPS.
Vous pouvez également changer d’écran en glissant vers la gauche ou la droite.
Les onglets affichés ici peuvent être configurés dans le menu Configuration.
Section B - Profil & cible
Profil actuel
Le profil actuel est affiché dans la barre de gauche.
Un appui court sur le profil permet de voir les détails du profil. Un appui long sur le bouton de profil permet de changer de profil.
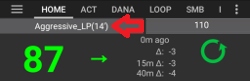
Affichage classique avec activation standard du profil.
Changement de profil avec une durée restante de 59mn.
Changement de profil avec un pourcentage spécifique de 120%.
Changement de profil avec un pourcentage spécifique de 80% et une durée restante de 59 mn.
Changement de profil avec un décalage horaire de -1 heure.
Changement de profil avec un pourcentage spécifique de 120%, un décalage horaire d’une heure et une durée restante de 59 mn.
Cible
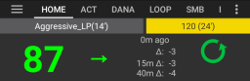
La cible de glycémie actuelle est affichée dans la barre de droite.
Un appui court sur le bouton de cible permet de définir une cible temporaire.
Si une cible temporaire est définie, le bouton devient jaune et le temps restant en minutes est affiché entre parenthèses.
Visualisation de l’ajustement dynamique de la cible
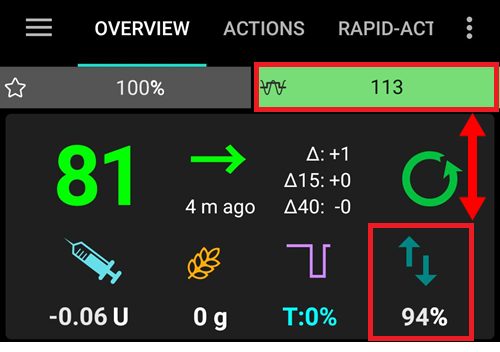
Lorsque vous utilisez l’algorithme SMB et Autosens , AAPS peut ajuster dynamiquement votre cible en fonction de la sensibilité.
Activez l’une ou les deux des options suivantes dans Préférences > OpenAPS SMB:
 * "Sensibilité augmente la cible" et/ou
 * "Résistance diminue la cible"
Si AAPS détecte une résistance ou une sensibilité, la cible change en fonction de ce qui est défini dans le profil. Lorsqu’il modifie la cible glycémique, l’arrière-plan passe en vert.
Section C - Gly & état de la boucle
Glycémie actuelle
La dernière glycémie reçue de votre MGC est affichée sur le côté gauche.
La couleur de la glycémie reflète sa position par rapport à la fourchette définie.
 * Vert = dans la plage
 * Rouge = au-dessous de la plage
 * Jaune = au-dessus de la plage

Les zones du milieu montrent :
combien de minutes depuis la dernière valeur MGC
différences avec la dernière valeur : Δ, et variation moyenne des 15 et 40 dernières minutes (Δ15 and Δ40).
Les deltas longs sont calculés comme une moyenne des derniers deltas, indiquant ainsi la variation moyenne de la glycémie.
État de la boucle
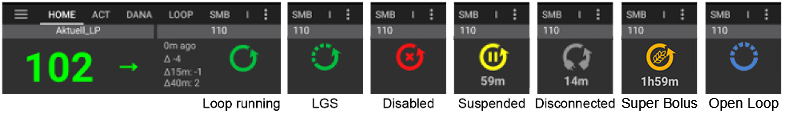
Sur le côté droit, une icône montre le statut de la boucle :
Green circle = closed loop, loop running
Purple circle with dotted line = low glucose suspend (LGS)
Cercle rouge = boucle désactivée (ne fonctionne pas de façon permanente)
Cercle rouge = boucle suspendue (suspension temporaire, mais l’insuline basale sera délivrée) - le temps restant est affiché sous l’icône
Cercle gris = pompe déconnectée (temporairement aucune insuline n’est délivrée) - le temps restant est affiché sous l’icône
Cercle orange = super bolus en cours - le temps restant est affiché sous l’icône
Blue circle with dotted line = open loop
Un appui court ou long sur l’icône de la boucle permet d’ouvrir une boite de dialogue pour changer la boucle (Fermée, Mode Arrêt Glycémie Basse, Ouverte), suspendre/réactiver la boucle ou déconnecter/reconnecter la pompe.
* If short press on Loop icon, a validation is required after selection in Loop Dialog

Avertissement Glycémie
Si pour une raison quelconque, il y a un problème avec les glycémies reçues par AAPS, vous verrez un triangle d’avertissement à côté de la glycémie sur l’écran principal.
Signe d’alerte rouge : données Gly dupliquées
Le triangle rouge nécessite une action de votre part immédiate : vous recevez des glycémies en double, ce qui empêche la boucle de faire son travail correctement. Par conséquent, votre boucle est désactivée jusqu’à ce que ce problème soit résolu.
{admonition} Votre boucle ne marche pas
:class: note
Votre boucle ne marche pas tant que vous ne résolvez pas ce problème !

Vous devez savoir pourquoi vous avez des Gly dupliquées :
Est-ce que la connexion avec Dexcom (Dexcom Bridge) est activée sur votre instance Nightscout ? Désactivez cette connexion en allant dans l’interface d’administration de votre instance Nightscout, éditez la variable « ENABLED » et retirez la partie « bridge » à cet endroit. (Pour heroku les détails peuvent être trouvés ici.)
Y a-t-il plusieurs sources qui envoient votre glycémie vers Nightscout ? Si vous utilisez l’application BYODA, activez l’envoi des données vers Nightscout dans AAPS mais ne l’activez pas dans xDrip+, si vous l’utilisez.
Avez-vous des suiveurs qui pourraient recevoir votre glycémie mais aussi la renvoyer vers votre site Nightscout ?
En dernier recours : Dans AAPS, allez dans Préférences > NSClient, puis dans les paramètres de synchronisation, désactivez l’option « Accepter les données MGC de NS ».
Pour faire disparaitre cette alerte immédiatement, vous devez supprimer manuellement quelques entrées dans l’onglet Dexcom/xDrip+.
Cependant, quand il y a beaucoup de doublons, il peut être plus facile de
réinitialiser votre base de données dans le menu de maintenance et
Signe d’alerte jaune
Le triangle d’alerte jaune indique que vos glycémies arrivent avec des intervalles de temps irréguliers ou qu’il manque des mesures. Lorsque vous appuyez sur le triangle, le message indique « Données recalculées utilisées ».

Habituellement, vous n’avez rien à faire. La boucle fermée va continuer à fonctionner !
Étant donné qu’un changement de capteur interrompt le flux régulier des glycémies, un triangle d’avertissement jaune après le changement de capteur est normal et ne doit pas vous inquiéter.
Note pour les utilisateurs du Freestyle libre :
Chaque capteur FSL glisse d’une ou deux minutes toutes les quelques heures, ce qui signifie que vous n’obtenez jamais un flux parfaitement régulier de glycémie.
En outre, des sauts de lectures interrompent le flux régulier.
Par conséquent, le triangle d’avertissement jaune sera “toujours visible” pour les utilisateurs du FreeStyle Libre.
Note: Up to 30h hours are taken into accord for AAPS calculations. Donc, même après avoir résolu la cause racine, cela peut prendre environ 30 heures pour que le triangle jaune disparaisse après le dernier interval irrégulier.
Mode simple
An icon with a kid’s face at the top right of this section indicates that you are in Simple mode.

Section D - IA, GA, Basal et AS
Syringe: insulin on board (IOB) - amount of active insulin inside your body
The insulin on board figure would be zero if just your standard basal was running and there was no insulin remaining from previous boluses.
L’IA peut être négative s’il y a eu récemment des périodes de basal réduit.
Appuyez sur l’icône pour voir la répartition entre l’IA bolus et l’IA basale
Grain: carbs on board (COB) - yet unabsorbed carbs you have eaten before The icon pulses red if carbs are required (see below)
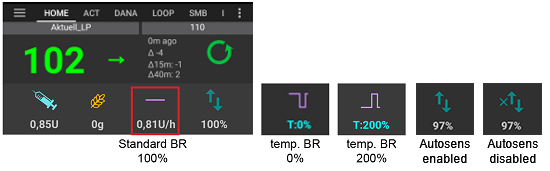
Ligne violette: basale actuelle. L’icône change pour montrer les taux de basale temporaires (ligne plate à 100%)
Appuyez sur l’icône pour voir le débit de basal du profil et les détails de n’importe quel basal temporaire (y compris la durée restante)
Arrows up & down: indicates dynamic sensitivity features status (Autosens or DynamicISF): enabled or disabled. Several values may be shown in this section:
AS: Autosens value. Shown even if Autosens is disabled (for information only). Also shown when DynISF is activated, although it has no effect.
Alg: DynamicISF value (based on TDD). More information on the last line on DynamicISF page.
Glucides requis
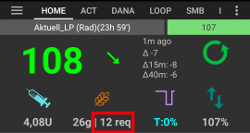
Des suggestions de glucides sont données lorsque l’algorithme détecte que des glucides supplémentaires sont nécessaires.
Cela se produit quand l’algorithme oref pense qu’il ne suffira pas de mettre la basale à zéro et que vous aurez besoin de vous resucrer.
Les notifications de glucides sont beaucoup plus sophistiquées que celles de l’Assistant bolus. Vous pouvez voir la suggestion des glucides alors que l’Assistant bolus ne montre pas les glucides manquants.
Les notifications Glucides requis peuvent être envoyées sur Nightscout si vous le souhaitez, dans ce cas une annonce sera affichée et diffusée.
Section E - Voyants d’état
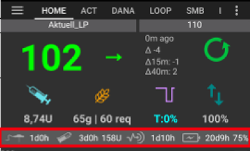
Les voyants d’état donnent une alerte visuelle pour
Âge de la canule
Âge de l’insuline (jours d’utilisation du réservoir)
Niveau du réservoir (unités)
Age du capteur
Âge et niveau de la pile (%)
Si le seuil d’alerte est dépassé, les valeurs seront affichées en jaune.
Si le seuil critique est dépassé, les valeurs seront affichées en rouge.
Les paramètres peuvent être modifiés dans Préférences > Aperçu > Voyants d’état.
Selon la pompe que vous utilisez, il se peut que vous n’ayez pas toutes ces icônes.
Section F - Graphique principal
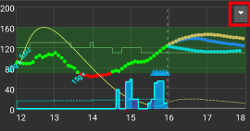
Le graphique montre votre glycémie telle qu’elle est lue par votre capteur de glycémie (MGC).
Use the menu on top left of the graph or long press anywhere on the graph to change the timescale. You can choose between 6, 12, 18 or 24 hours.
La zone verte reflète votre fourchette cible.
This information is also shown on this graph :
Boluses: blue triangle on the BG curve and insulin amount
Carbs entries: orange triangle on the BG curve and carb amount
Target as defined in the profile or modified by temporary target: green line
Profile switches: star at the top of the graph
Loop status: color line at the top of the graph when the status is anything else than closed loop - see Loop status for the colors
SMB - if enabled in Preferences > OpenAPS SMB: blue triangles at the bottom of the graph
Activation des informations optionnelles
Using the top right arrow, you can switch on these optional information:
Predictions (see below)
Treatments : notes entered in action tab: grey, orange or red dot depending on the severity, as well as fingerstick calibrations: red dot
Basals
As defined in the profile: blue dotted line at the bottom of the graph
Actually delivered basal: blue plain line with blue background
Activity - insulin activity curve: yellow line
Pour afficher ces informations, cliquez sur le triangle à droite du graphique principal. For the main graph just the four options above the line « Graph 1 2 3 4 » are available.

Lignes de prédiction
Ligne orange : Glucides Actifs (GA) (cette couleur est généralement utilisée pour représenter les Glucides et GA)
Cette ligne de prédiction montre comment votre glycémie (et pas les GA eux-mêmes) devrait évoluer sur la base de votre Profil actuel, en supposant que les déviations liées à l’absorption des glucides restent constantes. Cette ligne n’apparaît que s’il y a des GA connus.
Ligne bleu foncé : Insuline Active (IA) (cette couleur est généralement utilisée pour représenter l’insuline)
Cette ligne de prédiction montre ce qui pourrait arriver avec uniquement l’action de l’Insuline. Par exemple si vous avez injecté de l’insuline mais que vous n’avez pas mangé de glucides.
Ligne bleu clair ligne : zéro-temp (glycémie prévisionnelle si un débit de base temporaire à 0% était défini)
Cette ligne de prédiction montre comment la glycémie évoluerait si la pompe arrêtait toute injection d’insuline (DBT 0%).
Cette ligne n’apparaît que lorsque l’algorithme SMB est utilisé.
Ligne jaune foncé : RNS (Repas non signalés)
Les Repas Non Signalés signifient qu’une augmentation significative de la glycémie liée aux repas, à l’adrénaline ou à d’autres facteurs est détectée. Cette ligne de prédiction est similaire à la ligne orange des GA, mais elle suppose que les déviations diminueront de façon constante (en extrapolant le taux de diminution actuel).
Cette ligne n’apparaît que lorsque l’algorithme SMB est utilisé.
Ligne orange foncé : aGA (absorption accélérée des glucides)
Similaire à GA, mais en supposant un taux d’absorption de glucides statique de 10 mg/dL/5m (-0,555 mmol/l/5m). Obsolète et d’une utilité limitée.
Cette ligne n’apparaît que lorsque l’ancien algorithme AMA est utilisé.
Généralement votre courbe de glycémie réelle finira au milieu de ces lignes, ou proche de la ligne qui représente le mieux votre situation réelle.
Basals
Une ligne bleue continue indique le débit de basal de votre pompe et reflète l’injection réelle au fil du temps.
La ligne bleue pointillée est ce qu’aurait dû être le débit de basal s’il n’y avait pas d’ajustements de débit de basal temporaire (DBT).
Quand le débit de basal standard est donné, la zone sous la courbe est affichée en bleu foncé. Quand le débit de basal est temporairement ajusté (augmenté ou diminué), la zone sous la courbe est affichée en bleu clair.
Activité
La ligne jaune fine montre l’activité de l’insuline.
Elle indique la capacité de l’insuline présente dans votre corps à faire baisser la glycémie, si aucun autre facteur (comme les glucides) n’était présent.
Section G - Additional graphs
Vous pouvez activer jusqu’à quatre graphiques supplémentaires en dessous du graphique principal. When in Simple Mode, additional graphs are preset and can not be changed. Switch off Simple Mode if you wish to set your own configuration of additional graphs.
Pour ouvrir les paramètres des graphiques supplémentaires, cliquez sur le triangle sur la droite du graphique principal et faites défiler vers le bas.

To configure additional graphs, check the boxes corresponding to the data you want to see on each graph.
La plupart des utilisateurs apprécient la configuration suivante pour les graphiques supplémentaires :
Graph 1 with IOB, COB, Sensitivity change
Graphique 2 avec Déviations et Impact glycémique.
Insuline absolue
Insuline Active incluant les bolus et la basal.
Insuline active
Affiche la quantité d’insuline que vous avez à chaque instant (= insuline active dans votre corps). Il inclut l’insuline des bolus et des débits de basal temporaires, (mais exclut les débits de basal intégrés dans votre profil).
Dans l’hypothèse où il n’y aurait eu aucun SMB, bolus ni débit basal temporaire pendant toute la durée d’action de l’insuline (DAI), l’Insuline Active serait à zéro.
L’IA peut être négative si vous n’avez pas de bolus restants et et que vous avez eu une zéro/faible basal temp pendant longtemps.
La diminution (absorption) de l’insuline active est fonction des paramètres de DAI et d’insuline du profil.
Glucides actifs
Affiche la quantité de glucides que vous avez à chaque instant (= glucides actifs dans votre corps, non encore assimilés).
La diminution dépend des écarts que l’algorithme détecte.
S’il détecte une absorption plus élevée de glucides que prévu, de l’insuline sera injectée, ce qui augmentera l’IA (plus ou moins, selon vos paramètres de sécurité).
AutoSens
Affiche la sensibilité détectée par Autosens.
C’est le résultat d’un calcul de la sensibilité à l’insuline suite à de l’exercice, aux hormones, etc.
Note, you need to be in Objective 8 in order to let Sensitivity Detection/Autosens automatically adjust the amount of insulin delivered. Avant d’atteindre cet objectif, la ligne sur le graphique est affichée pour information seulement.
SI variable
Shows the sensitivity as calculated by DynamicISF. Only populated if you use this feature.
Heart rate & Steps
This data may be available when using a Wear smartwatch. Enable them on AAPS Wear app and give permission for health data.
Déviations
Les barres grises montrent une déviation dûe aux glucides.
Les barres vertes montrent que la glycémie est supérieure à ce qu’attendait l’algorithme. Les barres vertes sont utilisées par Autosens pour augmenter la résistance.
Les barres rouges montrent que la glycémie est inférieure à ce qu’attendait l’algorithme. Les barres rouges sont utilisées par Autosens pour augmenter la sensibilité.
Les barres jaunes montrent une déviation due aux RNS.
Les barres noires montrent de petites déviations non prises en compte pour la sensibilité.
Blood Glucose Impact
Cette ligne montre à quel point la glycémie devrait augmenter ou diminuer en prenant seulement en compte l’activité de l’insuline.

Cette ligne forme une bonne combinaison à afficher avec les barres de déviation. Elles partagent la même échelle, mais c’est une échelle différente de celle des autres données additionnelles, c’est donc une bonne idée de les afficher sur un graphique séparé, comme montré ci-dessus. Comparer la ligne d’IG et les barres de déviation est une autre façon de comprendre comment la glycémie fluctue. Ici, au moment marqué 1, les barres de déviation sont plus hautes que la ligne IG, indiquant que la glycémie monte. Plus tard, au cours des heures marquées 2, IG et DEV sont à peu près alignés, indiquant que la glycémie est stable.
Section H - Boutons
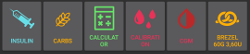
Buttons for Insulin and Carbs are almost always visible. If the connection to the pump is lost, the Calculator button will not be visible.
Other Buttons can be setup in Preferences > Overview > Buttons.
About using the Insulin, Carbs and Calculator buttons : If enabled in the Preferences > Overview, the Notes field allows you to enter text that will show on the main graph, and may be uploaded to Nightscout - depending on your settings for NS client.
Insuline
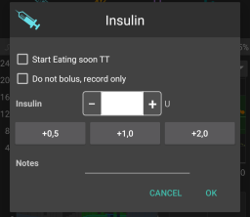
To give a certain amount of insulin without using the bolus calculator.
By checking the box Start eating soon TT, you can automatically start your eating soon temp target.
If you do not want to bolus through the pump but record an insulin amount (i.e. insulin given by pen) check the corresponding box. When checking this box, you get an additional field “Time offset”, that you can use to record an insulin injection made in the past.
You can use the buttons to quickly increase the insulin quantity. The increment values can be changed in the Preferences > Overview > Buttons.
The insulin button can be used when the pump is suspended as well, i.e. to record insulin injected with a pen. In this case, the header will show in yellow, and the checkbox “Do not bolus, record only” can not be unchecked.

Glucides
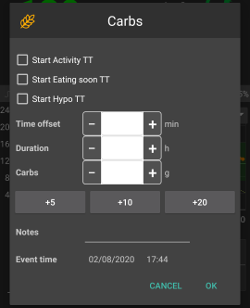
Permet d’enregistrer les glucides sans faire de bolus.
Certain pre-set temporary targets can be set directly by checking the box.
Time offset: When will you / have you been eaten carbs (in minutes).
Duration: To be used for « extended carbs »
You can use the buttons to quickly increase the carb amount. The increment values can be changed in the Preferences > Overview > Buttons.
Assistant
See Bolus Wizard section below.
Étalonnages
Envoie un étalonnage à xDrip+ ou ouvre la boîte de dialogue de calibration du Dexcom.
Must be activated in Preferences > Overview > Buttons.
MGC
Ouvre xDrip+.
Back button returns to AAPS.
Must be activated in Preferences > Overview > Buttons.
Assistant Rapide
Entrez facilement la quantité de glucides et définissez les paramètres de calcul.
Details are set up in Preferences > Overview > QuickWizard settings.
Assistant bolus
When you want to make a meal bolus, this is where you will normally make it from.
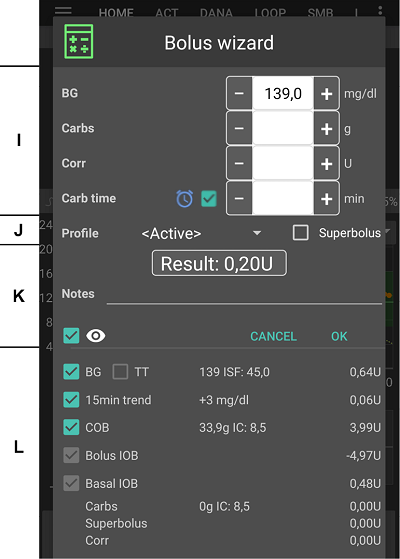
Section I
Affiche le bolus calculé et permet de renseigner une note.
Si la quantité d’insuline active dépasse déjà le bolus calculé, elle affichera simplement la quantité de glucides encore nécessaire.
Section J
Le champ « Gly » est normalement déjà renseigné avec la dernière lecture de votre MGC. Si vous n’avez pas de MGC en cours, il sera vide.
In the Carbs field, you add your estimate of the amount of carbs - or equivalent - that you want to bolus for.
The Corr field is if you want to modify the end dosage for some reason.
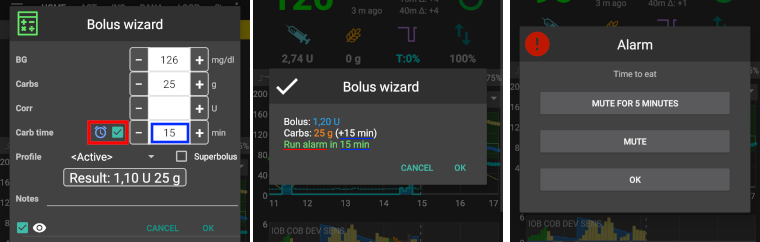
The Carb time field is for pre-bolusing so you can tell the system that there will be a delay before the carbs are to be expected. Vous pouvez mettre une valeur négative dans ce champ si vous faites un bolus pour des glucides déjà consommés.
Eating reminder : For carbs in the future, the alarm checkbox can be selected (and is by default when a time in the future is entered) so that you can be reminded at the given time, when to eat the carbs you have input into AAPS.
Section K
Profile allows you to select a different profile than the current one, to make the calculation for the insulin required. This profile selection applies only for the current bolus, it is not a profile change.
Super Bolus is where the basal insulin for the next two hours is added to the immediate bolus and a zero TBR is issued for the following two hours to take back the extra insulin. The option only shows when « Enable Superbolus in wizard » is set in the Preferences > Overview > Advanced Settings. L’idée est de fournir l’insuline plus tôt et, espérons-le, de réduire les pointes.
Pour plus de détails, voir diabetesnet.com.
Section L
Details of the wizard’s bolus calculation.
You can deselect any that you do not want to include, but you normally wouldn’t want to.
For safety reasons the TT box must be ticked manually, if you want the bolus wizard to calculate based on an existing temporary target.
Combinaisons de COB (Carb On Board = glucides actifs) et IOB (Insulin On Board = insuline active) et leur signification
For safety reasons, the IOB box cannot be unticked when COB box is ticked as you might run the risk of too much insulin as AAPS is not accounting for what’s already given.
If you tick COB and IOB, unabsorbed carbs that are not already covered with insulin + all insulin that has been delivered as TBR or SMB will be taken into account.
If you tick IOB without COB, AAPS takes account of already delivered insulin but won’t cover that off against any carbs still to be absorbed. Cela conduit à un avis de « manque de glucides ».
Si vous faites un bolus pour de la nourriture supplémentaire rapidement après un bolus de repas (par exemple pour un dessert supplémentaire) il peut être utile de décocher toutes les cases. De cette façon, les nouveaux glucides seront juste additionnés car le repas principal ne sera pas nécessairement absorbé et l’IA ne correspondra pas avec le GA aussi prêt d’un bolus de repas.

The box near the eye allows you to choose between the detailed view, with the numbers entering the calculation for each item, or the simple view with icons. Pressing on an icon will enable / disable this entry from the calculation.
Détection incorrecte des GA
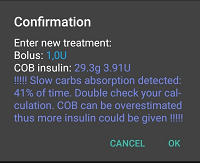
If you see the warning above after using bolus wizard, AAPS has detected that the calculated COB value may be wrong. So, if you want to bolus again after a previous meal with COB, you should be aware of overdosing!
For details, see the hints on COB calculation page.
Onglet Actions
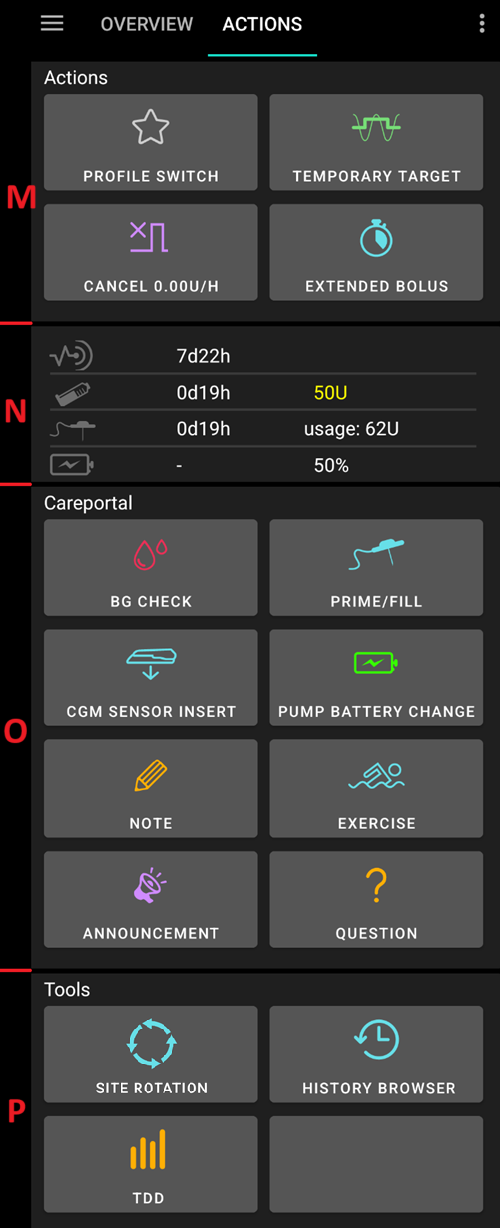
Actions - section M
Button Profile switch as an alternative to pressing the current profile on homescreen.
Button Temporary target as an alternative to pressing the current target on homescreen.
Le bouton pour démarrer ou annuler un débit basal temporaire. Veuillez noter que le bouton passe de « BASAL TEMPORAIRE » à « ANNULER x% » lorsqu’un débit de base temporaire est défini.
Even though extended boluses do not really work in a closed loop environment some people were asking for an option to use extended bolus anyway.
Cette option n’est disponible que pour les pompes Dana RS et Insight.
La boucle fermée sera automatiquement arrêtée et basculera en mode boucle ouverte pour la durée du bolus étendu.
Make sure to read the details before using this option.
Careportal - section N
Afficher les informations:
 * sensor age & level (battery percentage)
 * insulin age & level (units)
 * cannula age
 * pump battery age & level (percentage
Less information will be shown if low resolution skin is used (Preferences > General > Skin).
Niveau du capteur (batterie)
Works for CGM with an additional transmitter such as MiaoMiao 2. (Techniquement le capteur doit envoyer les informations de niveau de pile à xDrip+).
Thresholds can be set in Preferences > Overview > Status lights.
Careportal - section O
Contrôle glycémie, Amorcer/Remplir, Insertion capteur MGC et Changement pile pompe sont les données d’entrées des informations affichées dans la section N.
Amocer/Remplir vous permet d’enregistrer le changement de site et de la cartouche d’insuline de la pompe.
La section O vous permet de renseigner les infos Careportal de Nightscout. Ainsi, Activité physique, Notification et Question sont des formes spéciales de Remarques ou Notes.
Outils - section P
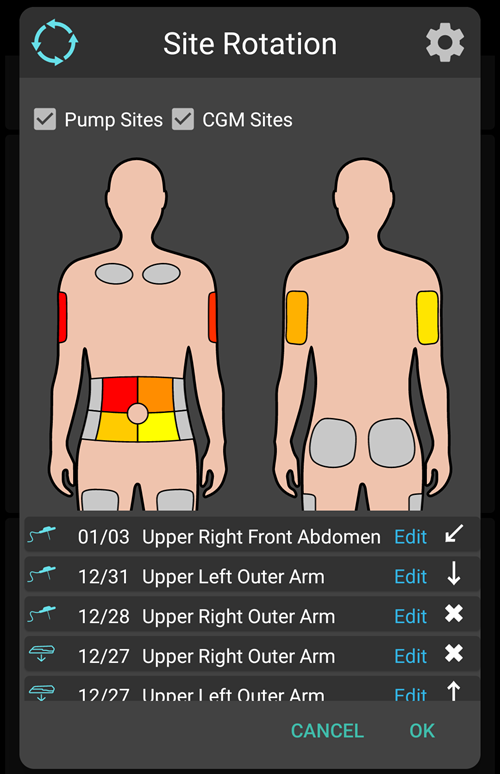
Rotation du site
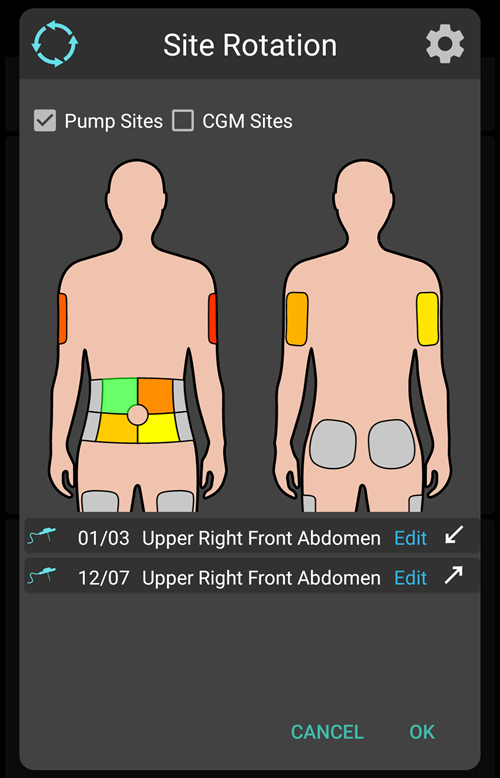
Le bouton Rotation du site ouvre le dialogue de rotation du site en mode Visualisation :
Vous pouvez sélectionner si vous voulez voir les Sites de la Pompe uniquement, les Sites du capteur MGC uniquement, ou les deux avec des cases à cocher en haut
Tous les changements de canule et le changement de capteur depuis les 45 derniers jours sont disponibles.
Cliquez sur une des zones, ou dans une entrée de la liste du dessous pour filtrer la liste avec seulement des entrées dans la zone sélectionnée. La zone sélectionnée sera surlignée de couleur vert clair.
You can open the Edit view to update Site location, Arrow, or Comment associated to each entry
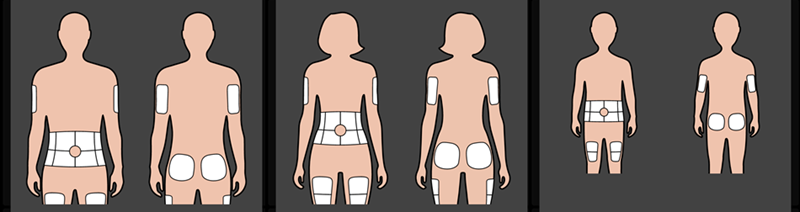
The Setting tab (upper right cog) allows you to adjust the patient view (Man, Woman or Child), and to select if you want to manage only Pump sites, only Sensor sites or both.
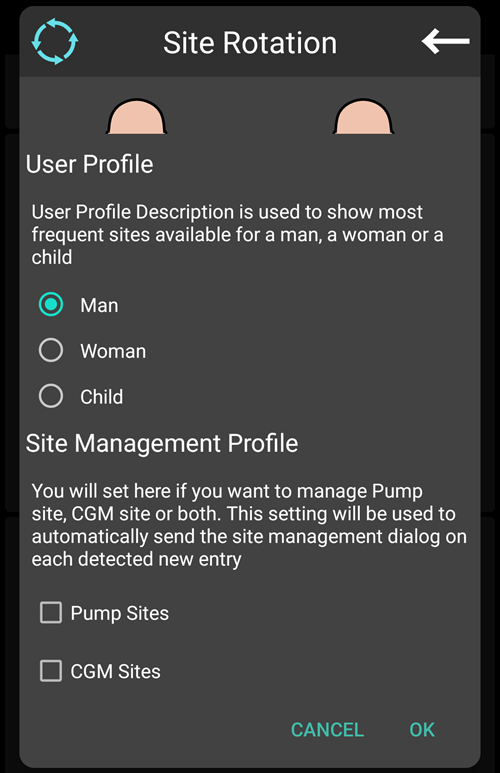
Note: this setting will be used to automatically open or not Site Rotation Dialog (Edit mode) when a new entry is done from « Prime/Fill button » or « CGM Sensor Insert button »
For Site change done directly from Pump, you have to open the View Mode and Edit the new entry to select Location and Arrow
Edit Mode allows you to select Location, Arrow, and Note associated to selected Entry:
Entry type is visible on the to of Edit mode (Cannula Icon, or Sensor Icon)
You have to select Front or Back tab and then the Area
Once a Site selected (highlighted in green), you will see in the list below the list of all entries done in the pas 45 days in this site
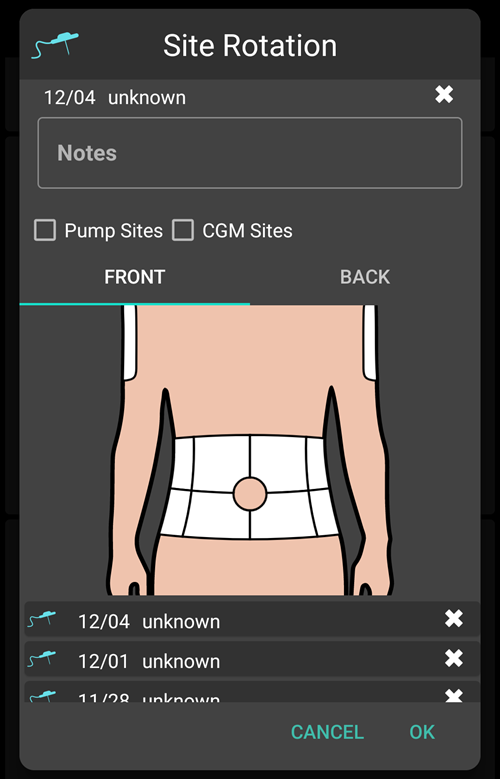
You can adjust an optional arrow with a click on little arrow icon on the top (Arrow allow you to precise sub-location, from 2 to 9, or Pod Orientation)
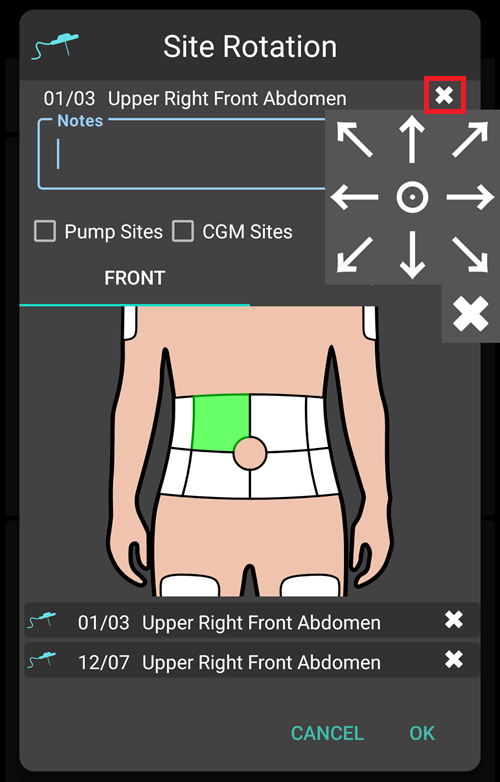
You can also adjust comments concerning selected site
After confirmation, the site is recorded
Filtering can be done graphically on the image, or clicking a therapy event in the list To remove filtering, just click on the image outside any sites
Historique
Allows you to ride back in AAPS history.
DTQ
Dosage Total d’Insuline = bolus + base par jour
Certains médecins utilisent - en particulier pour les nouveaux utilisateurs de pompes - une proportion basal-bolus de 50:50.
Therefore, ratio is calculated as TDD / 2 * TBB (Total base basal = sum of basal rate within 24 hours).
D’autres préfèrent une fourchette allant de 32% à 37% de DTQ pour DTB.
Comme la plupart de ces règles empiriques, leur validité réelle est limitée. Remarque : Votre diabète peut varier!
Profil d’Insuline
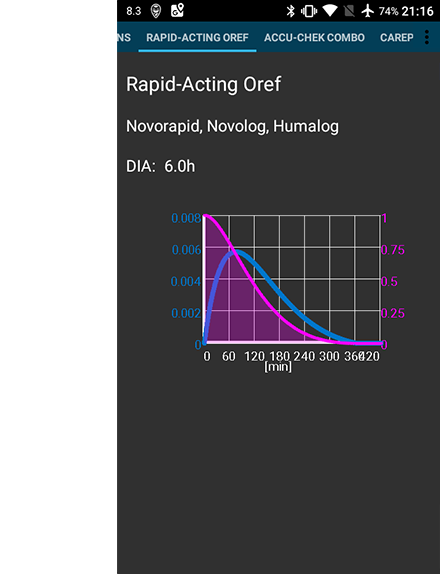
This shows the activity profile of the insulin you have chosen in Config builder > Insulin. The curves will vary based on the DIA and the time to peak.
The purple line shows how much insulin remains after it has been injected as it decays with time and the blue line shows how active it is.
See Your AAPS Profile > Duration of insulin action to learn more about what it is and how to set it.
Statut de la pompe
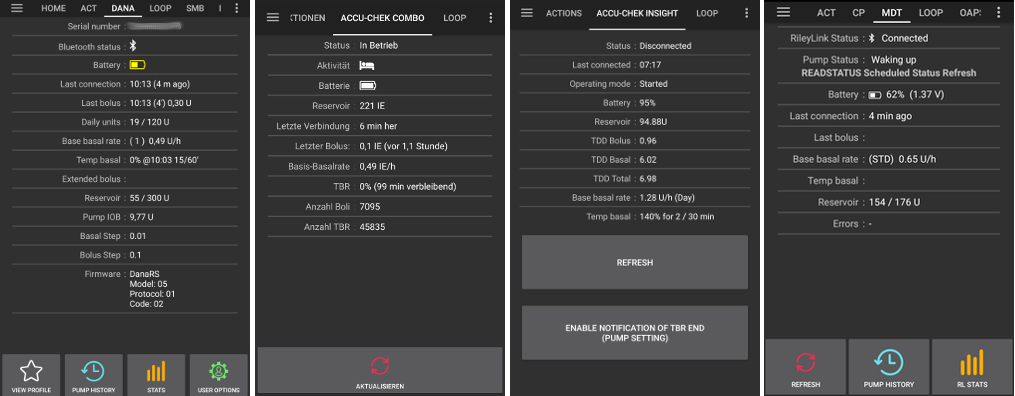
Contient différentes informations sur l’état de la pompe. Les informations affichées dépendent du modèle de votre pompe.
See pumps page for details.
Boucle / AMA / SMB
These tabs show details about the algorithm’s calculations and why AAPS acts the way it does.
Calculations are run each time the system gets a fresh reading from the CGM.
For more details see APS section on config builder page.
Profil
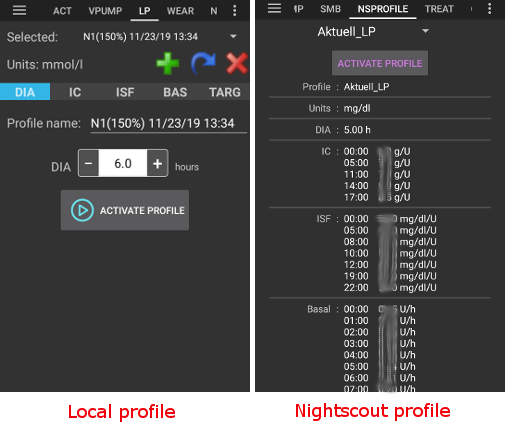
Profile contains information on your individual diabetes settings, see the detailed Profile page for more information.
Automatisation
See the dedicated page here.
NSClient
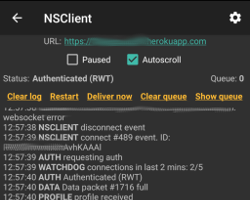
This page displays the status of the connection with your Nightscout site.
Settings can be changed in Preferences > NS Client.
For troubleshooting see this page.
Source Glycémie - xDrip+, BYODA…

Depending on your BG source settings, this tab is named differently.
Shows history of CGM readings and offers option to remove reading in case of failure (i.e. compression low) or duplicate readings.
Traitements
This view can be accessed by pressing the 3 dots on the right of the menu, then Treatments. It is not possible to show it in the main menu through the Config Builder. In this view, you can view and alter the history of the following treatments:
Bolus & carbs
Basal temporaire
Careportal: notes entered through action tab and notes in dialogues
Running mode : history of loop status
User entry: other notes that are not sent to Nightscout
In the last column, the data source for each line is displayed in blue. It can be :
NS for Nightscout : the data comes from or has been recorded to Nightscout
PH for Pump History : the data has been processed by the pump
Bolus & carbs

On this tab you can view the bolus and carbs log. Each bolus (line 1 and 4) shows the remaining associated IOB next to the insulin amount. The origin of the bolus can be either :
Meal (manually entered though the Insulin, Quick Wizard or Bolus Wizard buttons)
SMB, when using the SMB Functionality
The carbs (line 2) are only stored in Nightscout. If you have used the Bolus Wizard to calculate insulin dosage, you can press the “Calc” text (line 3) to show the details of how the bolus was calculated.
Depending on the pump used, insulin and carbs can be shown in one single line, or will result in multiple lines: one for the calculation detail, one for the carbs, one for the bolus itself.
The treatment tab can be used to correct faulty carb entries (i.e. you over- or underestimated carbs). Note that it is not possible to edit an existing entry, you need to follow the following process:
Vérifiez et mémorisez les GA et IA actuels sur l’écran d’accueil.
Selon la pompe, dans l’onglet Traitement, les glucides peuvent être affichés avec l’insuline sur une seule ligne ou dans deux lignes séparées (par ex. avec Dana RS).
Supprimez l’entrée qui a la mauvaise quantité de glucides. (Latest versions have trashcan icon in treatments screen. Press the trashcan icon, select the lines to remove, and then press the trashcan icon again to finalize.)
Assurez-vous que les glucides ont bien été enlevés en vérifiant à nouveau les GA sur l’écran d’accueil.
Vérifiez également l’IA s’il n’y a qu’une seule ligne dans l’onglet de Traitement contenant les glucides et l’insuline.
→ If carbs are not removed as intended, and you add additional carbs as explained here (6.), COB will be too high and that might lead to too high insulin delivery.
Entrez la bonne quantité de glucides par le bouton Glucides sur l’écran d’accueil et définissez l’heure correcte de l’événement.
S’il n’y a qu’une seule ligne dans l’onglet Traitement, contenant les glucides et l’insuline, vous devez remettre la quantité d’insuline qui a été injectée. Assurez-vous de régler correctement l’heure de l’événement et vérifiez bien l’IA sur l’écran d’accueil après avoir confirmé la nouvelle entrée.
Basal Temp.

The temp basals applied by the loop are shown here. When there is still an impact on the IOB for an entry, the information is shown in green. It can be:
Positive IOB if the temp basal was higher than the one set in the Profile (line 2)
Negative IOB for a zero-temp or if the temp basal was lower than the one set in the Profile (line 1)
Deleting the entries only affects your reports in Nightscout and will probably tamper your real IOB - it is not recommended.
On the left of a line, a red S means “Suspend” : it happens when basal is not currently delivered. This is a normal situation when in the process of changing a pod, for example.
Cible Temp

The history of temporary targets can be seen here.
Changement profil

The history of profile switches can be seen here. You may see multiple entries each time you switch profile : line 1, stored in Nightscout but not in Pump History, corresponds to the request of a profile switch made by the user. Line 2, stored both in NS and PH, correspond to the actual switch.
Deleting the entries only affects your reports in Nightscout and will never actually change the current profile.
You can use the Clone button shown on line 1 to make a copy of a Profile Switch. See Your AAPS Profile > Manage your profiles for more information.
En cours de fonctionnement
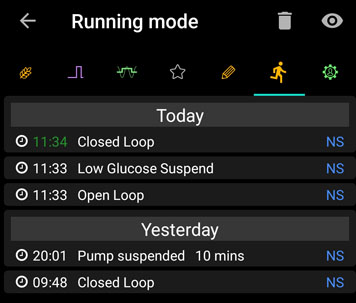
This tab shows the history of loop status changes : open, closed, suspend loop.
Care portal

This tab shows all notes and alerts recorded in Nightscout.
Historique
This view can be accessed by pressing the 3 dots on the right of the menu, then History. It is not possible to put in the main menu through the Config Builder. It can also be accessed through a button at the bottom of the Action tab.
Allows you to ride back in AAPS history. See the dedicated page Reviewing your data > History Browser.
Statistics
This view can be accessed by pressing the 3 dots on the right of the menu, then Statistics. It is not possible to put in the main menu through the Config Builder.
Gives you statistics about your Time In Range and Total Daily Dose. See the dedicated page Reviewing your data > Statistics.
Profile Helper
This view can be accessed by pressing the 3 dots on the right of the menu, then Profile Helper. It is not possible to put in the main menu through the Config Builder. The Profile Helper can help you: