AAPS screens
Hlavní stránka
This is the first screen you will come across when you open AAPS and it contains most of the information that you will need day to day.
Sekce A – Karty
Navigate between the various AAPS modules.
Obrazovky můžete také změnit tak, že přejedete prstem doleva nebo doprava.
Zobrazené karty mohou být vybrány v konfiguraci.
Sekce B – Profil & cíl
Aktuální profil
Aktuální profil je zobrazen v levém panelu.
Krátkým stiskem panelu profilu zobrazíte detaily profilu
Dlouhým stiskem panelu profilu přepínejte mezi různými profily.
Pokud byl profil přepnut s dobou trvání, tak se zbývající minuty platnosti profilu zobrazí v závorkách.
Cíl
Aktuální cílová hladina glykémie je zobrazena v pravém řádku.
Krátkým stisknutím cílové hodnoty nastavíte dočasný cíl.
Pokud je nastaven dočasný cíl, zobrazí se žlutě a zbývající čas v minutách bude zobrazen v závorkách.
Vizualizace dynamické úpravy cíle
AAPS může dynamicky upravovat vaši cílovou hodnotu na základě citlivosti, pokud používáte algoritmus SMB.
Povolte jednu nebo obě následující možnosti
„citlivost zvyšuje cíl“ a/nebo
„rezistence snižuje cíl“
Jestliže AAPS detekuje rezistenci nebo citlivost, cíl se bude lišit od hodnoty, která je nastavena v profilu.
Když tato funkce změní cílovou glykémii, její hodnota bude podbarvena zeleně.
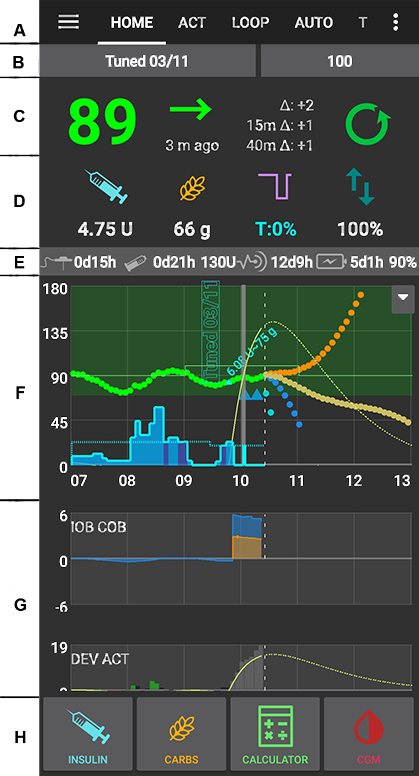
Sekce C – glykémie a stav smyčky
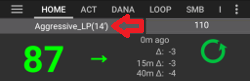
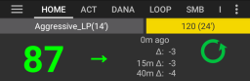
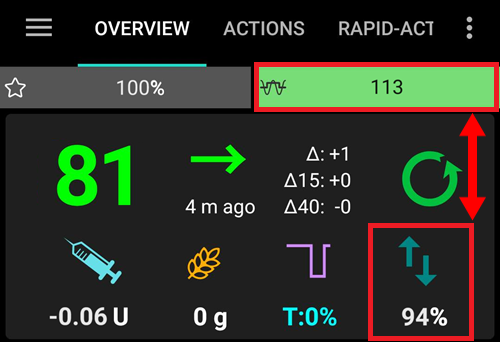
Aktuální hodnota glykémie
Nejnovější glykémie z CGM je zobrazena na levé straně.
Barva hodnoty glykémie odráží stav vzhledem k definovanému rozsahu.
zelená = v rozmezí
červená = pod cílovým rozmezím
žlutá = nad cílovým rozmezím
Šedý blok uprostřed zobrazuje minuty od posledního načtení hodnoty a změny od posledního čtení, za posledních 15 a 40 minut.
Stav smyčky
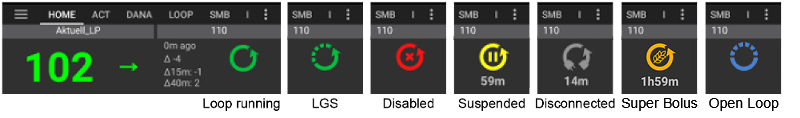
Nová ikona zobrazující stav smyčky:
zelený kruh = smyčka běží
zelený kruh s tečkovanou čárou = režim vypnutí před nízkou (LGS)
červený kruh = smyčka vypnutá (nefunguje trvale)
žlutý kruh = smyčka pozastavena (dočasně pozastavena, ale bude vydán bazální inzulin) - zbývající čas je zobrazen pod ikonou
šedý kruh = pumpa odpojena (dočasně žádný výdej inzulínu) - zbývající čas je zobrazen pod ikonou
Oranžový kruh = je spuštěn superbolus - zbývající čas je zobrazen pod ikonou
modrý kruh s tečkovanou čárou = otevřená smyčka
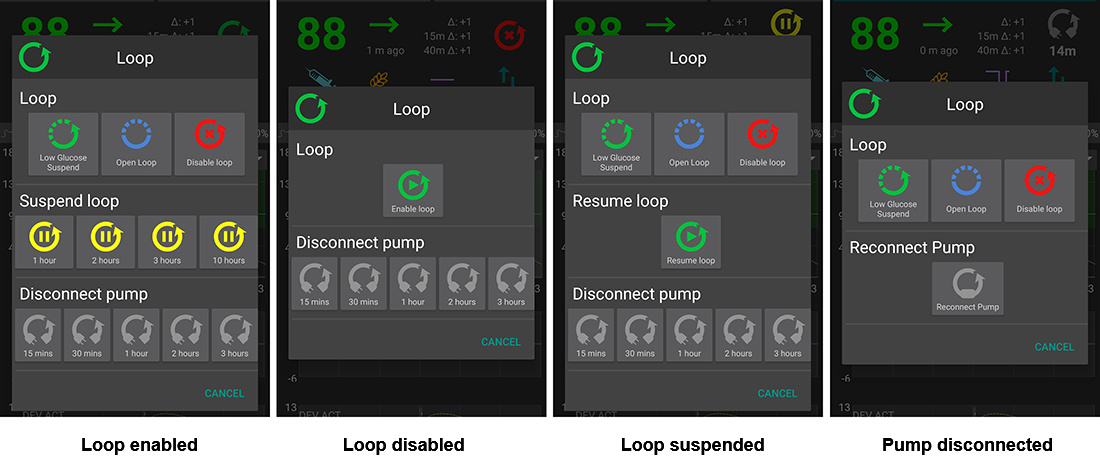
Krátkým nebo dlouhým stiskem ikony otevřete dialog smyčky pro přepnutí režimu smyčky (Uzavřená smyčka, Zastavení před nízkou, Otevřená smyčka, Vypnuto), pozastavit / znovu povolit smyčku nebo odpojit / znovu připojit pumpu.
Pokud krátce stisknete ikonu smyčky, je po výběru některé možnosti v dialogu smyčky vyžadováno ověření
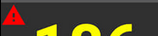
BG warning sign
Beginning with Android 3.0, you might get a warning signal beneath your BG number on the main screen.
Note: Up to 30h hours are taken into accord for AAPS calculations. So even after you solved the origin problem, it can take about 30 hours for the yellow triangle to disappear after the last irregular interval occurred.
To remove it immediately you need to manually delete a couple of entries from the Dexcom/xDrip+ tab.
However, when there are a lot of duplicates, it might be easier to
reset your database in the maintenance menu and
import your settings again
Red warning sign: Duplicate BG data
The red warning sign is signaling you to get active immediately: You are receiving duplicate BG data, which does avoid the loop to do its work right. Therefore your loop will be disabled until it is resolved.
You need to find out why you get duplicate BGs:
Is Dexcom bridge enabled on your NS site? Disable the bridge by going to heroku (or any other hosting provider), edit the „enable“ variable and remove the „bridge“ part there. (For heroku details can be found here.)
Do multiple sources upload your BG to NS? If you use the BYODA app, enable the upload in AAPS but do not enable it in xDrip+, if you use that.
Do you have any followers that might receive your BG but do also upload it again to your NS site?
Last resort: In AAPS, go to your NS Client settings, select the sync settings and disable the „Accept CGM data from NS“ option.
Yellow warning sign
The yellow warning signal is indicating that your BG arrived in irregular time intervals or some BGs are missing.

Usually you do not have to take any action. The closed loop will continue to work!
As a sensor change is interupting the constant flow of BG data a yellow warning sign after sensor change is normal and nothing to worry about.
Special note for libre users:
Every single libre slips a minute or two every few hours, meaning you never get a perfect flow of regular BG intervals.
Also jumpy readings interrupt the continous flow.
Therefore the yellow warning sign will be ‚always on‘ for libre users.
Sekce D – IOB, COB, BR a AS
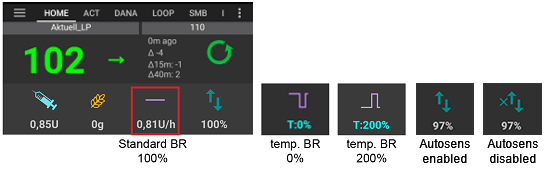
Injekční stříkačka: aktivní inzulín (IOB) - množství aktivního inzulinu v těle
Ukazatel aktivního inzulínu by měl být nula, pokud běží pouze váš standardní bazál a žádný z předchozích bolusů už nemá aktivní zůstatek.
IOB může být i záporný, pokud byl dříve aktivován snížený bazál.
Stisknutím ikony zobrazíte rozdělení bolusové a bazální dávky
Grain: carbs on board (COB) - yet unabsorbed carbs you have eaten before -> icon pulses if carbs are required
Purple line: basal rate - icon changes reflecting temporary changes in basal rate (flat at 100%)
Stisknutím ikony zobrazíte základní bazální dávku a podrobnosti o jakémkoli dočasném bazálu (včetně zbývající doby trvání)
Šipky nahoru a dolů: indikace aktuálního stavu autosens (povoleno nebo zakázáno) a hodnota je zobrazena pod ikonou
Požadavek sacharidů
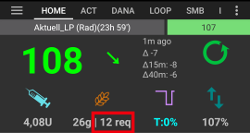
Návrhy sacharidů jsou uvedeny v případě, že algoritmus detekuje potřebu sacharidů.
Děje se tak tehdy, když si algoritmus oref myslí, že vás nedokáže zachránit zastavením bazálu (nulový bazál) a že budete potřebovat další sacharidy.
Oznámení jsou mnohem sofistikovanější než ta z bolusového kalkulátoru. Můžete vidět návrh sacharidů, zatímco bolusová kalkulačka neobsahuje chybějící sacharidy.
V případě potřeby může být notifikace vyžadovaných sacharidů odeslána do Nightscoutu. Notifikace se pak zobrazí v Nightscoutu a bude vysílána.
Sekce E – Stavové indikátory
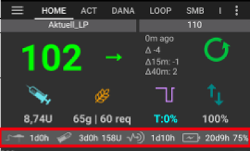
Stavové indikátory zobrazují vizuální varování pro
Stáří kanyly
Stáří inzulínu (doba použití aktuálního zásobníku)
Stav zásobníku (jednotky)
Stáří senzoru
Battery age and level (%)
If threshold warning is exceeded, values will be shown in yellow.
If threshold critical is exceeded, values will be shown in red.
Settings can be made in preferences.
Sekce F – Hlavní graf
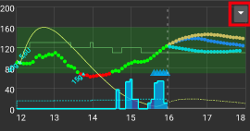
Graph shows your blood glucose (BG) as read from your glucose monitor (CGM).
Notes entered in action tab such as fingerstick calibrations and carbs entries as well as profile switches are shown here.
Long press on the graph to change the time scale. You can choose 6, 12, 18 or 24 hours.
The green area reflects your target range. It can be configured in preferences.
Blue triangles show SMB - if enabled in preferences.
Optional information:
Predikce
Basals
Activity - insulin activity curve
Activate optional information
Click the triangle on the right side of the main graph to select which information will be displayed in the main graph.
For the main graph just the three options above the line „——- Graph 1 ——-“ are available.
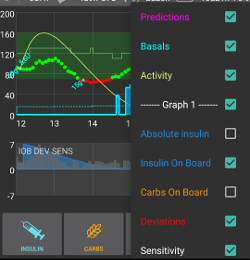
Prediction lines
Orange line: COB (colour is used generally to represent COB and carbs)
Prediction line shows where your BG (not where COB itself!) will go based on the current pump settings and assuming that the deviations due carb absorption remain constant. This line only appears if there are known COB.
Dark blue line: IOB (colour is used generally to represent IOB and insulin)
Prediction line shows what would happen under the influence of insulin only. For example if you dialled in some insulin and then didn’t eat any carbs.
Light blue line: zero-temp (predicted BG if temporary basal rate at 0% would be set)
Prediction line shows how the IOB trajectory line would change if the pump stopped all insulin delivery (0% TBR).
This line appears only when the SMB algorithm is used.
Dark yellow line: UAM (un-announced meals)
Unannounced meals means that a significant increase in glucose levels due to meals, adrenaline or other influences is detected. Prediction line is similar to the ORANGE COB line but it assumes that the deviations will taper down at a constant rate (by extending the current rate of reduction).
This line appears only when the SMB algorithm is used.
Dark orange line: aCOB (accelerated carbohydrate absorption)
Similar to COB, but assuming a static 10 mg/dL/5m (-0.555 mmol/l/5m) carb absorption rate. Deprecated and of limited usefulness.
This line appears only when the older AMA algorithm is used.
Usually your real glucose curve ends up in the middle of these lines, or close to the one which makes assumptions that closest resemble your situation.
Basals
A solid blue line shows the basal delivery of your pump and reflects the actual delivery over time.
The dotted blue line is what the basal rate would be if there were no temporary basal adjustments (TBRs).
In times standard basal rate is given the area under the curve is shown in dark blue.
When the basal rate is temporarily adjusted (increased or decreased) the area under the curve is shown in light blue.
Activity
The thin yellow line shows the activity of Insulin.
It is based on the expected drop in BG of the insulin in your system if no other factors (like carbs) were present.
Sekce G – Další grafy
You can activate up to four additional graphs below the main graph.
To open settings for additional graphs click the triangle on the right side of the main graph and scroll down.
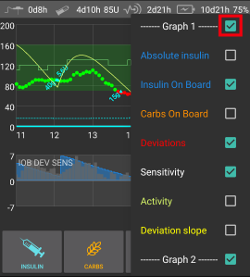
To add an additional graph check the box on the left side of its name (i.e. ——- Graph 1 ——-).
Absolute insulin
Active insulin including boluses and basal.
Insulin on board
Shows the insulin you have on board (= active insulin in your body). Zahrnuje inzulín z bolusu a dočasného bazálu (ale nezahrnuje bazální dávky nastavené ve vašem profilu).
Pokud by neexistovaly žádné SMB, žádné bolusy ani žádné TBR během doby DIA, tato hodnota by byla nula.
IOB může být záporný, pokud již není aktivní žádný bolus a po delší dobu byl nastaven nulový/nízký dočasný bazál.
Odbourávání závisí na vaší hodnotě DIA a nastavení inzulinového profilu.
Zbývající sacharidy
Shows the carbs you have on board (= active, not yet decayed carbs in your body).
Vstřebávání závisí na odchylkách, které detekuje algoritmus.
Pokud se zjistí vyšší absorpce, než se očekávalo, může dojít k vydání inzulinu. To bude mít za následek zvýšení IOB (zda více či méně závisí na vašich bezpečnostních nastaveních).
Odchylky
ŠEDÉ sloupce zobrazují odchylku způsobenou sacharidy.
ZELENÉ sloupce ukazují, že je glykémie vyšší, než algoritmus očekával. Green bars are used to increase resistance in Autosens.
ČERVENÉ sloupce ukazují, že je glykémie nižší, než algoritmus očekával. Red bars are used to increase sensitivity in Autosens.
YELLOW bars show a deviation due to UAM.
BLACK bars show small deviations not taken into account for sensitivity
Citlivost
Shows the sensitivity that Autosens has detected.
Sensitivity is a calculation of sensitivity to insulin as a result of exercise, hormones etc.
Activity
Shows the activity of insulin, calculated by your insulin profile (it’s not derivative of IOB).
The value is higher for insulin closer to peak time.
It would mean to be negative when IOB is decreasing.
Deviation slope
Internal value used in algorithm.
Section H - Buttons
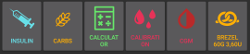
Buttons for insulin, carbs and Calculator are almost’always on‘.
If connection to pump is lost, the insulin button will not be visible.
Other Buttons have to be setup in [preferences]Preferences-buttons).
Inzulín
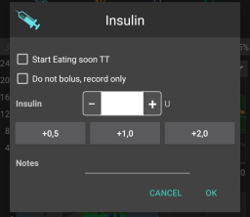
To give a certain amount of insulin without using bolus calculator.
By checking the box you can automatically start your eating soon temp target.
If you do not want to bolus through pump but record insulin amount (i.e. insulin given by syringe) check the corresponding box.
Sacharidy
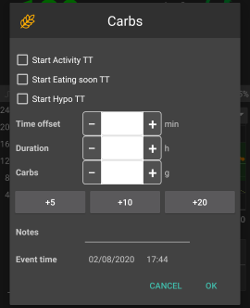
To record carbs without bolusing.
Certain pre-set temporary targets can be set directly by checking the box.
Time offset: When will you / have you been eaten carbs (in minutes).
Duration: To be used for „extended carbs“
You can use the buttons to quickly increase carb amount.
Notes will be uploaded to Nightscout - depending on your settings for NS client.
Kalkulačka
See Bolus Wizard section below
Calibrations
Sends a calibration to xDrip+ or opens Dexcom calibration dialogue.
Must be activated in preferences.
CGM
Opens xDrip+.
Back button returns to AAPS.
Must be activated in preferences.
Průvodce rychlým bolusem
Easily enter amount of carbs and set calculation basics.
Details are setup in preferences.
Bolus Wizard
When you want to make a meal bolus this is where you will normally make it from.
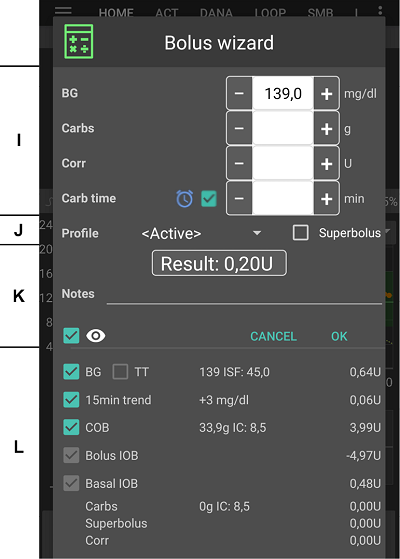
Section I
BG field is normally already populated with the latest reading from your CGM. If you don’t have a working CGM then it will be blank.
In the CARBS field you add your estimate of the amount of carbs - or equivalent - that you want to bolus for.
The CORR field is if you want to modify the end dosage for some reason.
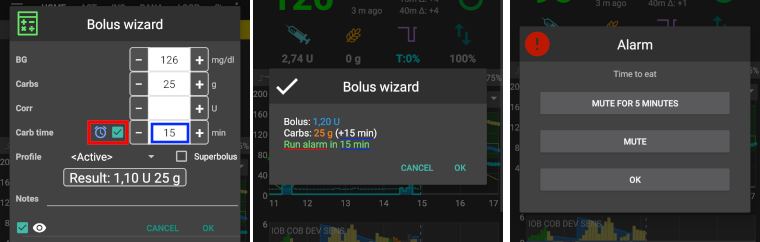
The CARB TIME field is for pre-bolusing so you can tell the system that there will be a delay before the carbs are to be expected. You can put a negative number in this field if you are bolusing for past carbs.
Eating reminder
For carbs in the future the alarm checkbox can be selected (and is by default when a time in the future is entered) so that you can be reminded at a time in the future of when to eat the carbs you have input into AAPS
Section J
SUPER BOLUS is where the basal insulin for the next two hours is added to the immediate bolus and a zero TBR is issued for the following two hours to take back the extra insulin. The option only shows when „Enable superbolus in wizard“ is set in the preferences overview.
The idea is to deliver the insulin sooner and hopefully reduce spikes.
For details visit diabetesnet.com.
Section K
Shows the calculated bolus.
If the amount of insulin on board already exceeds the calculated bolus then it will just display the amount of carbs still required.
Notes will be uploaded to Nightscout - depending on your settings for NS client.
Section L
Details of wizard’s bolus calculation.
You can deselect any that you do not want to include but you normally wouldn’t want to.
For safety reasons the TT box must be ticked manually if you want the bolus wizard to calculate based on an existing temporary target.
Combinations of COB and IOB and what they mean
For safety reasons IOB boxed cannot be unticked when COB box is ticked as you might run the risk of too much insulin as AAPS is not accounting for what’s already given.
If you tick COB and IOB unabsorbed carbs that are not already covered with insulin + all insulin that has been delivered as TBR or SMB will be taken into account.
If you tick IOB without COB, AAPS takes account of already delivered insulin but won’t cover that off against any carbs still to be absorbed. This leads to a ‚missing carbs‘ notice.
If you bolus for additional food shortly after a meal bolus (i.e. additional desert) it can be helpful to untick all boxes. This way just the new carbs are being added as the main meal won’t necessarily be absorbed so IOB won’t match COB accurately shortly after a meal bolus.
Wrong COB detection
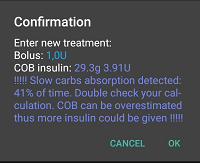
If you see the warning above after using bolus wizard, AAPS has detected that the calculated COB value maybe wrong.
So, if you want to bolus again after a previous meal with COB you should be aware of overdosing!
For details see the hints on COB calculation page.
Action tab
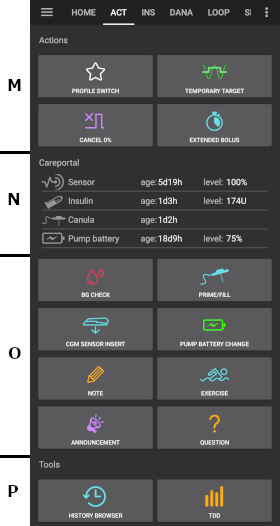
Actions - section M
Button profile switch as an alternative to pressing the current profile on homescreen.
Button temporary target as an alternative to pressing the current target on homescreen.
Button to start or cancel a temporary basal rate. Please note that the button changes from “TEMPBASAL” to “CANCEL x%” when a temporary basal rate is set.
Even though extended boluses do not really work in a closed loop environment some people were asking for an option to use extended bolus anyway.
This option is only available for Dana RS and Insight pumps.
Closed loop will automatically be stopped and switched to open loop mode for the time running extended bolus.
Make sure to read the details before using this option.
Careportal - section N
Displays information on
sensor age & level (battery percentage)
insulin age & level (units)
cannula age
pump battery age & level (percentage
Less information will be shown if low resolution skin is used.
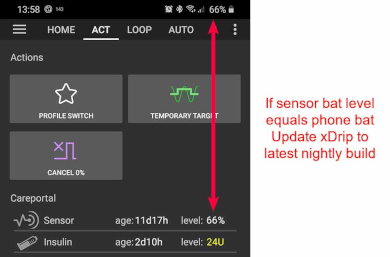
Sensor level (battery)
Needs xDrip+ nightly build Dec. 10, 2020 or newer.
Works for CGM with additional transmitter such as MiaoMiao 2. (Technically sensor has to send cat level information to xDrip+.)
Thresholds can be set in preferences.
If sensor level is the same as phone battery level you xDrip+ version is probably too old and needs an update.
Careportal - section O
BG check, prime/fill, sensor insert and pump battery change are the base for the data displayed in section N.
Prime/Fill allows you to record pump site and insulin cartridge change.
Section O reflects the Nightscout careportal. So exercise, announcement and question are special forms of notes.
Tools - section P
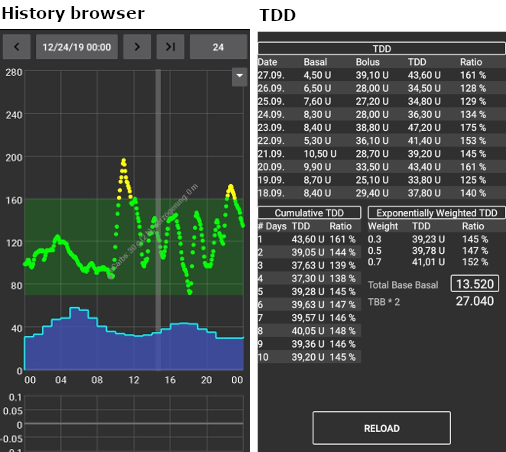
History Browser
Allows you to ride back in AAPS history.
CDD
Total daily dose = bolus + basal per day
Some doctors use - especially for new pumpers - a basal-bolus-ratio of 50:50.
Therefore ratio is calculated as TDD / 2 * TBB (Total base basal = sum of basal rate within 24 hours).
Others prefer range of 32% to 37% of TDD for TBB.
Like most of these rules-of-thumb it is of limited real validity. Note: Your diabetes may vary!
Inzulínový profil
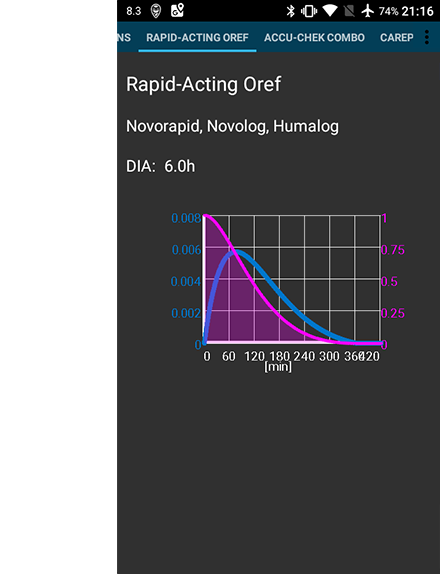
This shows the activity profile of the insulin you have chosen in config builder.
The PURPLE line shows how much insulin remains after it has been injected as it decays with time and the BLUE line shows how active it is.
The important thing to note is that the decay has a long tail.
If you have been used to manual pumping you have probably been used to assuming that insulin decays over about 3.5 hours.
However, when you are looping the long tail matters as the calculations are far more precise and these small amounts add up when they are subjected to the recursive calculations in the AAPS algorithm.
For a more detailed discussion of the different types of insulin, their activity profiles and why all this matters you can read an article here on Understanding the New IOB Curves Based on Exponential Activity Curves
And you can read an excellent blog article about it here: Why we are regularly wrong in the duration of insulin action (DIA) times we use, and why it matters…
And even more at: Exponential Insulin Curves + Fiasp
Stav pumpy
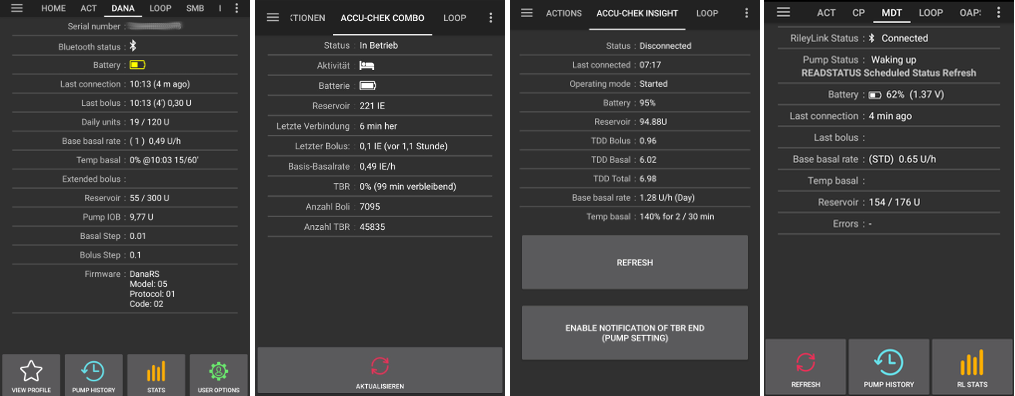
Different information on pump status. Displayed information depends on your pump model.
See pumps page for details.
Péče
Careportal replicated the functions you will find on your Nightscout screen under the “+” symbol which allows you to add notes to your records.
Review carb calculation
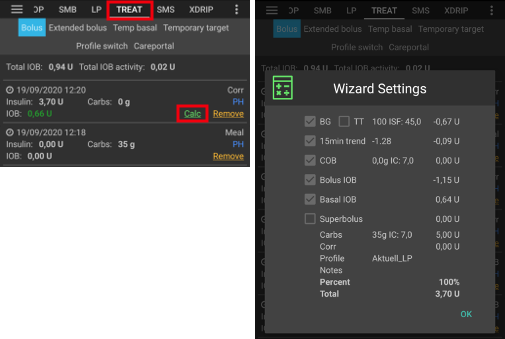
If you have used the Bolus Wizard to calculate insulin dosage you can review this calculation later on ts tab.
Just press the green Calc link. (Depending on pump used insulin and carbs can also be shown in one single line in ts.)
Korekce sacharidy
Treatment tab can be used to correct faulty carb entries (i.e. you over- or underestimated carbs).
Zkontrolujte a zapamatujte si aktuální COB a IOB na domovské obrazovce.
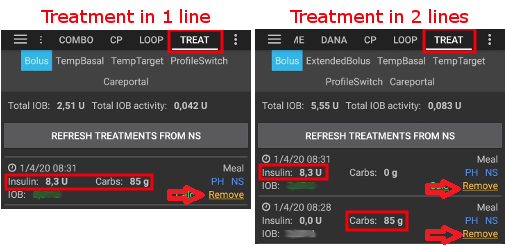
V závislosti na pumpě se mohou sacharidy v záložce ošetření zobrazovat společně s inzulínem v jednom řádku nebo jako samostatný záznam (např. s Danou RS).
Odstraňte záznam s chybným množstvím sacharidů.
Ujistěte se, že sacharidy byly úspěšně odstraněny kontrolou COB na domovské obrazovce.
Kontrolu proveďte také pro IOB, pokud v záložce ošetření jeden řádek obsahuje sacharidy i inzulín.
-> Nejsou-li sacharidy odstraněny tak, jak bylo zamýšleno, a přidáte další sacharidy, jak je zde vysvětleno (6.), COB budou příliš vysoké a to může vést k podání příliš vysokého množství inzulínu.
Zadejte správné množství sacharidů pomocí tlačítka na domovské obrazovce a ujistěte se, že jste nastavili správný čas události.
Pokud je v záložce ošetření pouze jedna řádka obsahující sacharidy i inzulín, musíte také přidat množství inzulínu. Nezapomeňte nastavit správný čas události a po potvrzení nového záznamu zkontrolujte IOB na domovské obrazovce.
Loop, AMA / SMB
These tabs show details about the algorithm’s calculations and why AAPS acts the way it does.
Calculations are each time the system gets a fresh reading from the CGM.
For more details see APS section on config builder page.
Profil
Profile contains information on your individual diabetes settings:
DIA (Duration of Insulin Action)
IC or I:C: Insulin to Carb ratio
ISF: Insulin Sensitivity Factor
Basal rate
Target: Blood glucose level that you want AAPS to be aiming for
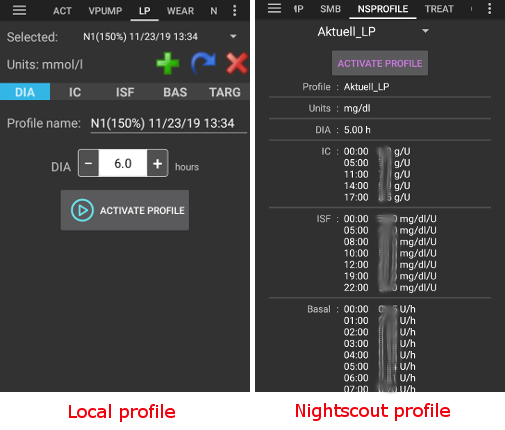
As of version 3.0 only local profile is possible. The local profile can be edited on your smartphone and synced to your Nightscout site.
Bolus
History of the following treatments:
Bolus & carbs -> option to remove entries to correct history
Temporary basal rate
Careportal - notes entered through action tab and notes in dialogues
BG Source - xDrip+, BYODA…
Depending on your BG source settings this tab is named differently.
Shows history of CGM readings and offers option to remove reading in case of failure (i.e. compression low).
NSClient
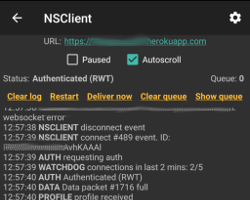
Displays status of the connection with your Nightscout site.
Settings are made in preferences. You can open the corresponding section by clicking the cog wheel on the top right side of the screen.
For troubleshooting see this page.